A trading journal that remembers every trade.
Axiom Companion is the founder's private trading desk. Every alert, trade, chart and replay session lands in one journal, and the stats count R, not hope.
Journal
Daily R calendar
TFGC 5m · NQ 5m · BTC 2m · ETH 2mOne trade, four places.
The alert fired in TradingView, the ping landed in Telegram, the chart sat in a screenshots folder and the result went in a spreadsheet. Nothing agreed.
{"dir":"long","entry":4526.6}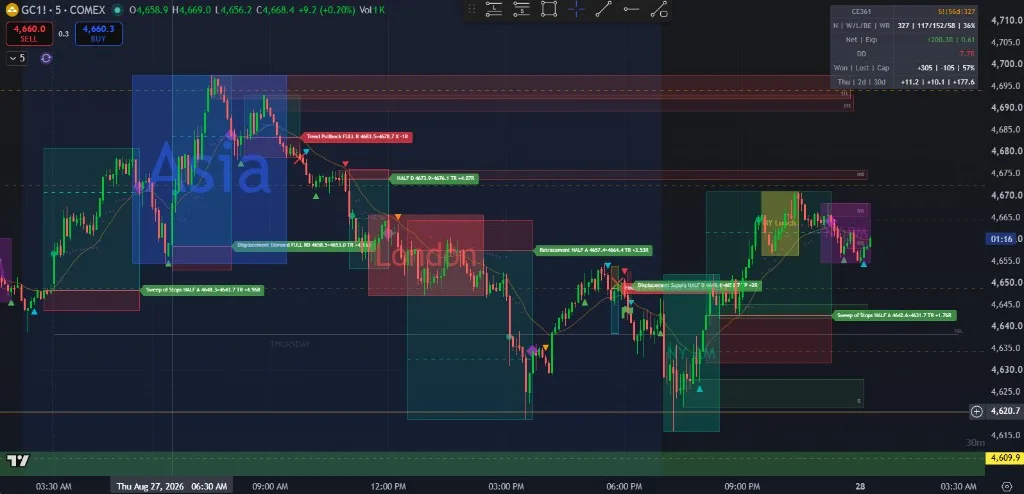
The alert becomes the journal entry.
A webhook turns every alert into a trade with entry, stop and target already filled in. Closing it is one tap on the phone.
Chart attachedTarget hit at 05:10 · +2.00R
Every session keeps its charts.
The notebook files each replay session with its captures and notes, so a good day can be checked, not just remembered.
Gold 5m: London sweep, NY runner
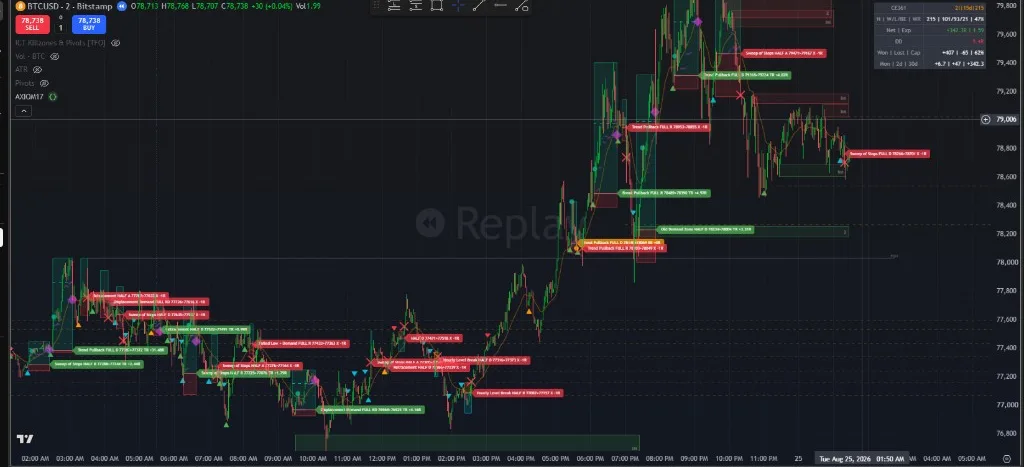
BTC + ETH 2m full-day review
15 hand-resolved trades
Asia range, skipped setups
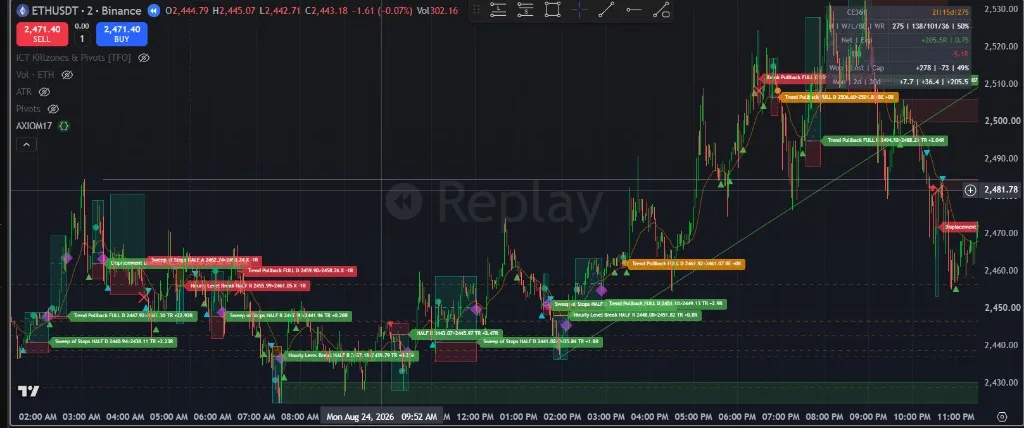
Note Best trade came from the 10:18 displacement after the sweep. Skip retracement shorts into the London high.
Chart captures are real TradingView replay sessions from the founder's notebook. Replay results are practice data, not live trades.
Measured in R, split by setup.
Every number is in R, so a win on gold and a win on Nasdaq mean the same thing. Replay, backtest and live never mix.
One line for the whole book.
Green dots are wins, red are losses. The curve redraws for any date range or timeframe.
Tested before it was trusted.
A 5-year gold backtest, filed apart from replay and live results.
What actually pays.
Each setup gets its own win rate and total R.
Ask the journal a question.
Axi answers from the trades on file, with the numbers it used.
Built for the phone in your hand.
Real screens from the running app: the calendar, the alert trail and a day opened up.
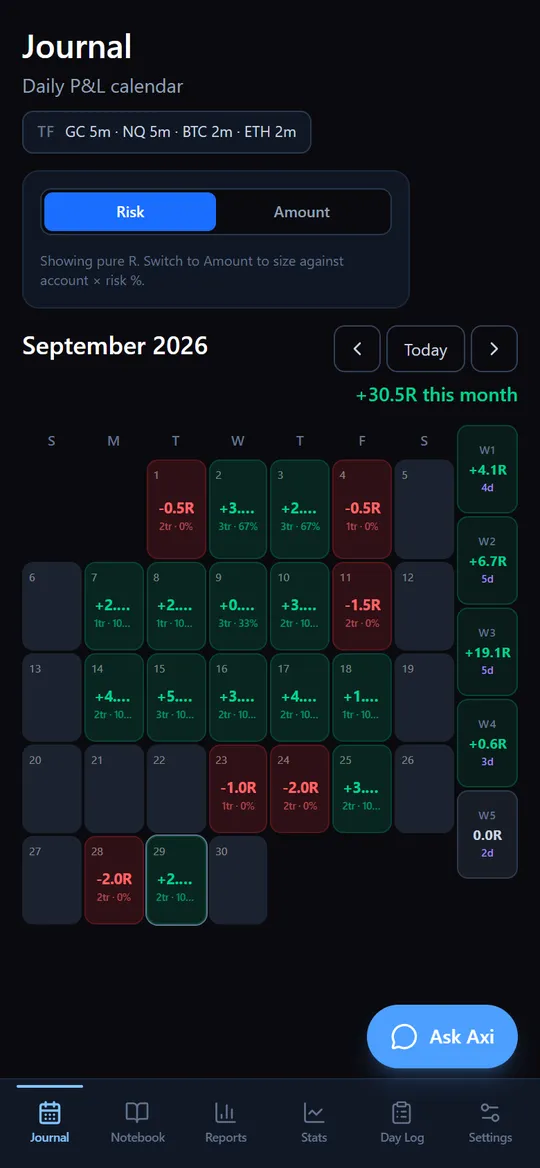
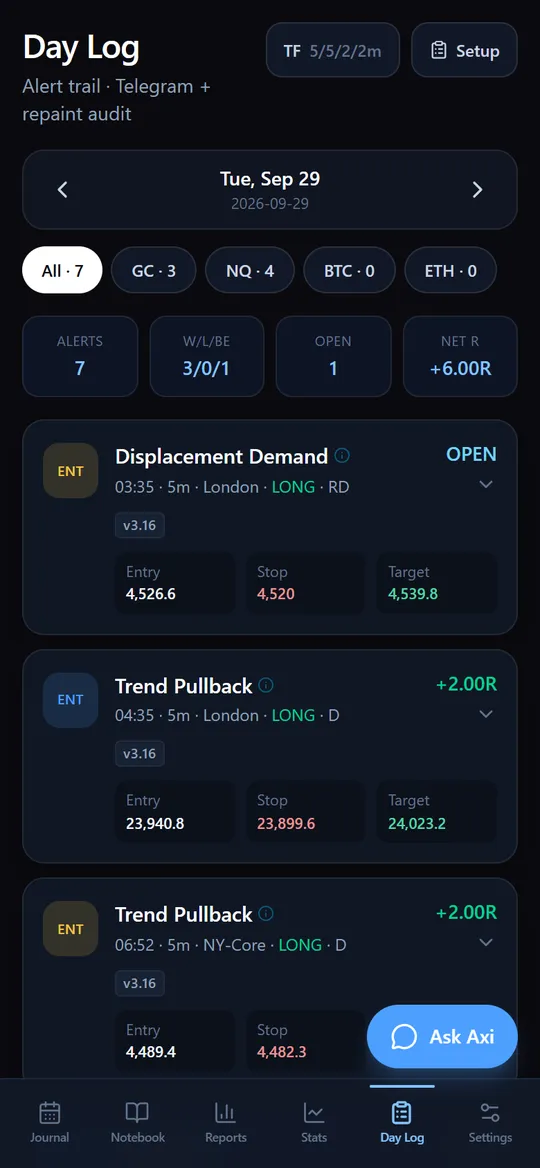
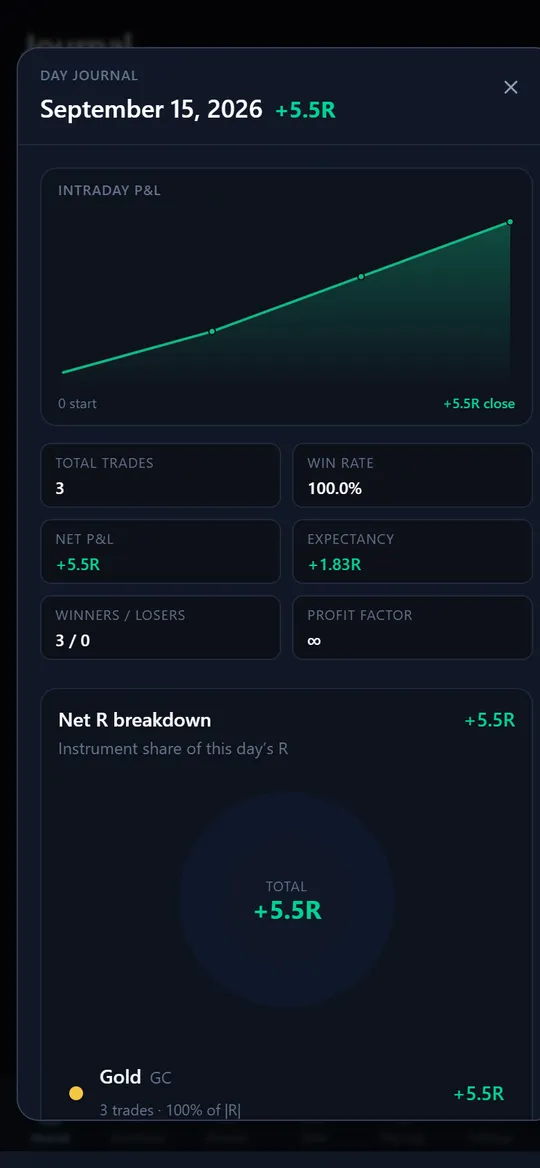
Screens captured from the local build in sample-data mode.
From chart to journal, no copy-paste.
One pipeline carries a trade from the chart to the stats page.
A Pine Script alert sends JSON with setup, direction and levels.
A signed webhook writes the signal to Supabase and pings Telegram and push.
Win, loss or break-even, logged in R with the chart attached.
Calendar, setups, sessions and equity curve recompute on their own.
Claude writes the weekly review and answers questions about the book.
"Replay R is not live R. The app keeps them apart."The rule the journal is built on. Numbers on this page are sample or backtest data, never live returns, and nothing here is trading advice.
Want a tool like this built around how you work?
We design and build private dashboards, journals and internal apps that pull your data into one place. Start with a clarity session.